
Rebalance: Potential distribution
Potential distribution
When we started the preliminary investigations in connection with with we used to call Project Granddad, it quickly became apparent that we had to give our potential distribution an overhaul first.
When a youth player is "born", he is given a hidden potential, which is a number between 1 and 30. The scout can give you a hint where this number lies, but his evaluation has a built-in uncertainty and the different levels in his description (Promising, Formidable, Enormous etc.) are not evenly spaced across the span between 1 and 30.
The potential is the basis of how well a player trains, and therefore it form the very foundation of his ability progression and career. Before we could start designing a new player progression and age-related ability decline, this all-important foundation needed to be perfectly solid.
The formula that distributes potentials is over 10 years old and has never been thoroughly examined.
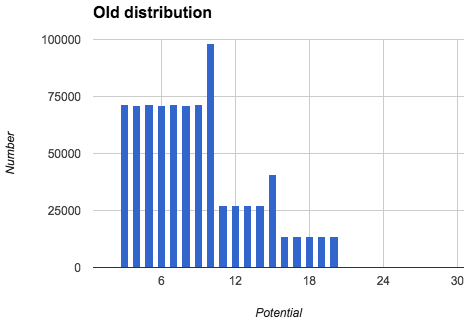
In the past year, managers have created about 815,000 youth players. If we draw 815,000 players with the old potential distribution, we get this:
| Potential | Old distribution | Percentage |
| 1 | 0 | 0.000% |
| 2 | 0 | 0.000% |
| 3 | 71305 | 8.749% |
| 4 | 71200 | 8.736% |
| 5 | 71606 | 8.786% |
| 6 | 71215 | 8.738% |
| 7 | 71351 | 8.755% |
| 8 | 71078 | 8.721% |
| 9 | 71411 | 8.762% |
| 10 | 98342 | 12.067% |
| 11 | 27303 | 3.350% |
| 12 | 27085 | 3.323% |
| 13 | 27090 | 3.324% |
| 14 | 27158 | 3.332% |
| 15 | 40594 | 4.981% |
| 16 | 13511 | 1.658% |
| 17 | 13524 | 1.659% |
| 18 | 13465 | 1.652% |
| 19 | 13508 | 1.657% |
| 20 | 13527 | 1.660% |
| 21 | 68 | 0.008% |
| 22 | 75 | 0.009% |
| 23 | 76 | 0.009% |
| 24 | 68 | 0.008% |
| 25 | 82 | 0.010% |
| 26 | 68 | 0.008% |
| 27 | 73 | 0.009% |
| 28 | 72 | 0.009% |
| 29 | 76 | 0.009% |
| 30 | 69 | 0.008% |
The potentials 1 and 2 where removed at one point, in a half-hearted attempt to make youth player drawings more interesting.
This distribution has a number of problems:
- The unexplainable spikes at potentials 10 and 15.
- The very uneven progression which results in huge chasms from 10 to 11, 15 to 16, and 20 to 21.
- The astoundingly small number of potentials of 21 to 30.
The large spikes at 10 and 15 results in disproportionately many players with the two exact potentials, which worsens the variation among players.
The huge chasms result in sudden and drastic jumps in the relationship between supply and demand between players who are only 1 potential point apart. That cannot be good for the player market.
Players with potentials between 21 and 30 make up only about 730 out of of a generation of 815,000, or 0.089%. This has to be the final nail in the coffin for the myth that "there are too many of the best players".
The unbelievably small number of players in the top 1/3rd of the potentials, and the drastic drop from 20 to 21 is a huge problem. It means that the 50-60 richest clubs can easily maintain completely monopoly on the upper 1/3rd of the possible potentials.
This is part of the reason why up-and-coming clubs eventually hit a brick wall and will never be able to threaten the old giants. The leap from having a team with players around 20 potential to 21+ is simply insurmountable.
The new distribution
The problems with the old distribution are many and serious, and they are at the core of the very foundation of player ability progression. These problems need to be solved first, otherwise any attempts to rebalance player progression will be for naught.
Over the course of several weeks, I've been discussing the problem with the Virtual Manager crew, and after looking at many different proposals, we've come up with a solution. I'd like to thank the crew for a really productive discussion. The formula that was finally accepted was proposed by one of the crew.
The new potential distribution will look like this. In the numbers below, I've once again run the formula on 815,000 players, representing a whole year of youth player drawings.
| Potential | Old distribution | Percentage | New distribution | Percentage |
| 1 | 0 | 0.000% | 2301 | 0.28% |
| 2 | 0 | 0.000% | 13279 | 1.63% |
| 3 | 71305 | 8.749% | 32316 | 3.97% |
| 4 | 71200 | 8.736% | 53509 | 6.57% |
| 5 | 71606 | 8.786% | 70682 | 8.67% |
| 6 | 71215 | 8.738% | 81262 | 9.97% |
| 7 | 71351 | 8.755% | 84630 | 10.38% |
| 8 | 71078 | 8.721% | 81981 | 10.06% |
| 9 | 71411 | 8.762% | 75205 | 9.23% |
| 10 | 98342 | 12.067% | 66066 | 8.11% |
| 11 | 27303 | 3.350% | 55985 | 6.87% |
| 12 | 27085 | 3.323% | 46054 | 5.65% |
| 13 | 27090 | 3.324% | 36938 | 4.53% |
| 14 | 27158 | 3.332% | 29030 | 3.56% |
| 15 | 40594 | 4.981% | 22512 | 2.76% |
| 16 | 13511 | 1.658% | 17063 | 2.09% |
| 17 | 13524 | 1.659% | 12803 | 1.57% |
| 18 | 13465 | 1.652% | 9432 | 1.16% |
| 19 | 13508 | 1.657% | 6950 | 0.85% |
| 20 | 13527 | 1.660% | 5059 | 0.62% |
| 21 | 68 | 0.008% | 3593 | 0.44% |
| 22 | 75 | 0.009% | 2584 | 0.32% |
| 23 | 76 | 0.009% | 1843 | 0.23% |
| 24 | 68 | 0.008% | 1296 | 0.16% |
| 25 | 82 | 0.010% | 904 | 0.11% |
| 26 | 68 | 0.008% | 640 | 0.08% |
| 27 | 73 | 0.009% | 437 | 0.05% |
| 28 | 72 | 0.009% | 302 | 0.04% |
| 29 | 76 | 0.009% | 208 | 0.03% |
| 30 | 69 | 0.008% | 136 | 0.02% |
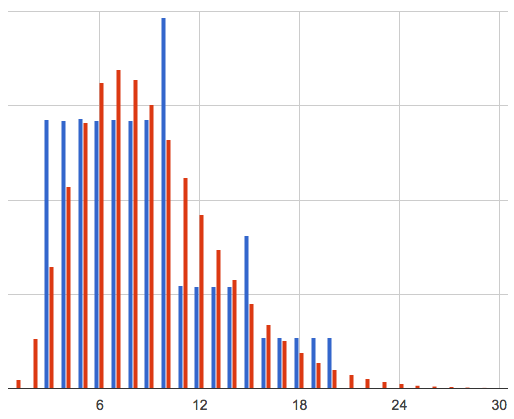
Looking at the two graphs side by side, it's clear to see what the new distribution achieves.
We get a nice curve where the huge spikes and chasms have been smoothed out.
From a potential of 7 and up, the supply decreases in a smooth curve all the way to 30, without any sudden jumps. Every time the potential increases by 1, the supply decreases (resulting in higher price), but at no point do you come to an chasm that you'll never cross.
The smooth curve brings us closer to the goal that the difficulty of the game should increase gradually and evenly, the higher your amibtions are. There are never any giant leaps in price from on potential to the next. In other works, it will always within the realm of possibility to improve your team just a tiny bit more.
The higher number of players with potentials of 21 to 30 means that the richest clubs will no longer be able to sit atop their thrones without a care in the world. The will still have th best teams in Virtual Manager, but all the new players from 21 and up will become the piranhas' teeth (read my previous blog post about Great White Sharks vs. Piranhas). These players, will be the the ones that ambitious new managers will be using to dethrone the old kings, if they slow down for just a second.
Next step: analysing player progression today and in the future
Obviously, we're not going to implement the new potential distribution on it's own. That would be disastrous with the current training system.
That's why our next task is to figure out the necessary adjustments to training, taking the new potential distribution into account.
First we need to analyse the state of things today. We need objective figures so that we can pinpoint the exact problems. Once that's done, we can start discussing which measures we need to take in order to achieve the goals I wrote about in my previous blog post. For instance, an appropriate number of players should be able to reach a Rating of 99, stay there for a while, and then start dropping. How much "an appropriate number" is, how long they should be able to remain at the top, how quickly they should drop etc., are all things that need to be discussed.
Right now I don't know exactly when the next blog post in this series about Project Rebalance will be, since I first need to get through another round of analysis and subsequent discussion with the crew. Project Rebalance will take a lot of discussion and surprisingly litte code, so it is being done alongside other jobs.
I hope this post gave everyone a more precise understanding of the first concrete measure we'll be taking as part of Project Rebalance and I'm looking forward to getting back to you with more figures and graphs about player progression.
This post is part of a series on Project Rebalance. If you haven't read the previous posts, you should do that first.